Monday 25 April 2016

Comments from Sharky! (The Sand)

Hello!


So you have already gathered and analysed the data referring to the sand!
Let's have a look... (updated 17th May)


Happy to see that all your coordinates are so accurate!

Let's have a look at your data. This is very interesting, you have very colourful beaches!
Now, by looking at the table try to finish the sentence:
(1) The coarser the sand is the .............. (steeper/flatter) is the slope of the beach face.
(2) Can you tell why?

All participating schools are invited to answer on this same post, just press on the 'No comments/comments' link!

And you can send your data if you haven't done it yet! The Sand >>

Looking forward to your comments!!!!!

Sharky


Monday 18 April 2016

Hi fishes,

It was awesome to work about the sand last week in Bot cove. Do you remember us? We are octopus.


Let's continue enjoying Oceans.
Hello mates,

 Here we are, 1st ESO E, enjoying Platja Cristal during the survey of "the sand" two weeks ago. ;-)


See you soon. Jellyfish.

Sunday 17 April 2016

Marine Species (Activity 4)

Hello! While you are finishing off activity nº3 the Sand, we are moving on to the next activity.


Activity nº 4: Marine species
Objective: create an infographic of the 10 most important species caught by the fishermen of your closest port using the ICT Piktochart >>

You will have to create an accountsign in, choose the option infographic, scroll down, choose the first template (Create your own infographic) and start editing.


Information included in the infographic:

An infographic is made by blocks, on the first block put the Title and Authors.

In the following blocks you will describe the marine species with the following information:
- Photo or some kind of illustration that allows its identification
-Common name in the local language
-Common name in English (only if local language is not English)
-Scientific name
-Percentage that represents the annual turn over
-Percentage of tonnes captured annually
-Any other information of YOUR INTEREST!

Once you have finished you can publish it and post the link provided by Piktochart on this blog to share it!

Source of data:
  • Survey at the port
  • Internet
(Teachers will supply you with the information about the survey, webpages and tutorial of Piktochart)

Label of the post: species
Deadline to complete the form: 2nd May
Suggestion: We recommend working in teams, where every group is in charge to look up different kinds of information.
Please remember only one infographic per class!

All the best!

The S'Agulla Team

Wednesday 13 April 2016

THE BEACH and THE WATER


THE    BEACH:                   

photo number 1:


photo number 2:
photo number 3:


photo number 4:

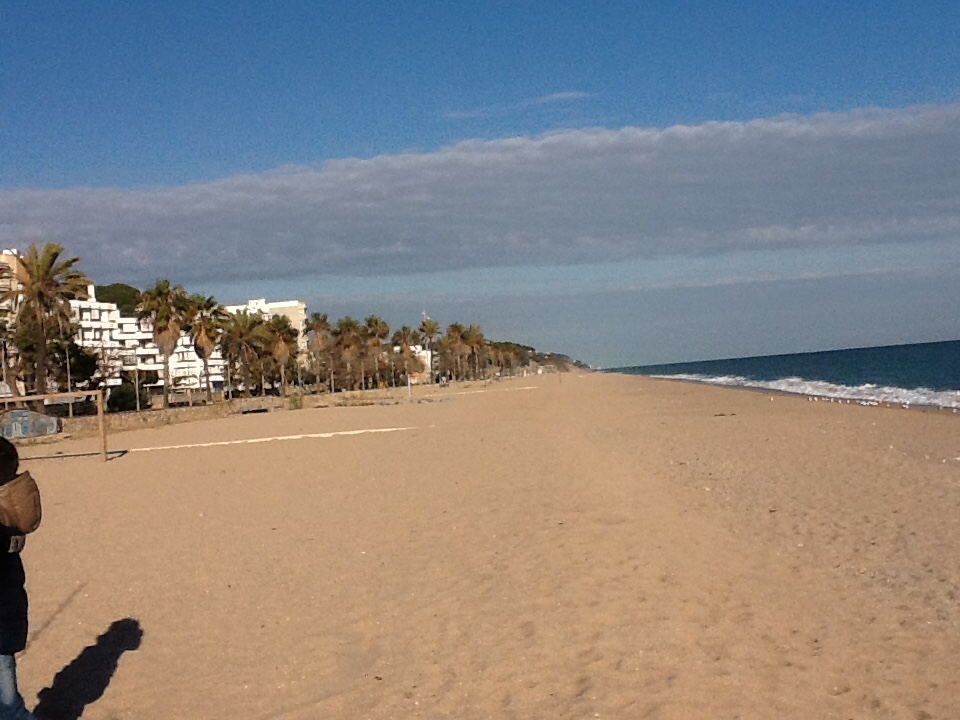
Cala Sant Francesc beach is wide and very beautiful. On the right there is a stone wall and if you look on the left, there is a rocky area and a door which has access to a path along the coast. In the middle, there is a sandy beach where people can sunbathe and go for a swim.


THE    WATER: 

photo number 5


Secchi Disc Data:
Depth Secchi Disc (Value A) : 17 m
Depth Secchi Disc (Value B): 17 m
Mean Depth: 17m
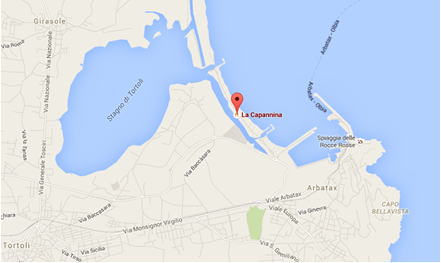
GPS:  Lat. 41.672559/ Long.2.796407
Lat:  N 41º 40' 21.2118"/ Long:  E 2º 47' 47.0646"  .....  on the boat

 number 6:  Picture of  Secchi Disc

Temperature sea water surface: 11ºC
Time: 12:15h
Date : 10/03/16
GPS:  Lat. 41.679167 / Long.2.8077778
Lat.  N 41º40'45'' / Long.  E  2º48'28''  .....on the beach  

photo number 7
We wrapped the thermometer in order to protect it and then we attached it to one end of the cane. The cane was provided by a teacher. It was from the forest near the school.


The MODIS Aqua data:


The tides:


                                                          the   beach of Santa Cristina


                                              desembocadura (the river mouth) del Tordera


After creating the graphic we realized that the tidal range was related to the lunar phases.


the moon  phases  from <http://www.space.com/images/i/397/i02/moon-phases-101111-02.jpg?1289850890>


Convection currents:


Water density/ Salinity/ Temperature:


Thanks:
 to the FP-initial PQPI and their teacher: they arranged the Secchi disk for us. We want to express our gratitude for creating this amazing material for us.

And finally we would like to express our gratitude to Joan Musoll for going with us in his rubber dinghy to help us take the Secchi disk data.

Monday 11 April 2016

on the right
Hi guys,
this is our beach named Calamosca, in Sardinia. It's very small, with a seashore of coarse sand, bordered on the western side by the promontory of Colle Sant'Elia.


in front of

                                     
behind

on the left


39°11'11.04''N  9°9'7.35''E
acqua , beach  1D liceo Alberti


Sunday 10 April 2016

Comments from Sharky (The Water)


Hello!!!
Thank you for keeping me up-to-date with your surveys, the photos are FANTASTIC! And I'm also looking forward to see the rest!!!


Ok, you have sent some data regarding the water, so let's have a look...(updated 20th April)


Ups! I'm afraid that coordinates for some beaches are not quite clear. The students of Ins Sant Pol 1A de Mar need to add if the latitude is north (N) or South (S) and the longitude East (E) or West (W), 1C latitude is not written with ºC it's just º (degrees), Istituto Superiore I.T.I. I'm afraid you need some more decimals to define better your position since you are in the middle of the sea. Check on Google Earth and you will see what I mean.
And Ins Lluís Domenech i Muntaner please use the standard way, having to swim so much to visit you it gets me confused, thank you! 

Also Ins Sant Pol 1C are you sure the current is SW? It looks like you are going the oposite way from the rest of the coast...

Especial congratulations to Ins Lluís Domenech i Muntaner and the white sharks from Ins Serrallarga for noticing that you had to add the coordinates of the Secchi depth measurement! Although Ins Lluís Domenech i Muntaner need to add more decimals, the coordinates are inland.. As you can see the S'Agulla Team have added these coordinates to the table. BRILLIANT!!!

You can all send the data you want to correct to Carol, the coordinator of the Oceans Project. at carol@sagulla.org. She will be very happy to update the information for you!

I see that you are all in the Mediterranean Sea and although Arbatax is further South than Miami platja you have similar temperatures. You all agree with the years of maximum and minimum SST oscillation and....
WAIT A MINUTE!!!!! Is the Mediterranean Sea like a lake???? You hardly have tides! But is it really???????

Ok, some of you have commented on currents and winds. So let me show you how much the water moves around in the Mediterranean:

You will find more information about how this video was produced HERE>>

But there's something that the octopus of Ins Antoni Ballester have said. They think that they have a deviation of SST average because their measure was taken only one day. Well, let me explain that sea temperature changes very slowly, 1ºC is a big difference! But you have been also been looking at a time series from 2002-2015, that means 13 years of data. Do you think that is long enough to say that there's a climate change?

You can answer by leaving a comment on this post! (Just press where it says 'No comments' and leave a comment)

Regards,

Sharky

PS: And don't forget to post the photos of your beach if you haven't done it yet!!!

Thursday 7 April 2016

Hei guys! 
In the first floor you will find the data of high and low tide supplied from "tide-forecast.com" site of the day we played the samples.

Below you will find instead the SST chart that we found on the site "Terra MODIS and MODIS Water" NASA.


Wednesday 6 April 2016

2a ITI Tortolì Sardinia

Hei! We are Mauro e Alessandro, we are students of second class in the High School ITI Tortolì.
Our coast is full of beaches; for our experiments, for transport issues, we chose the least representative tourist .....
A group of our class found photos and information from the beach, while 3 of us in the boat performed measurements with the Secchi disc.

That's where "La Capannina" on the map:


Guys, here's our photos:

                                  from right                                                                                from  behind 


                      from left                                                                                  in front of


Monday 4 April 2016

Presentation 1st Batxillerat Ins Argentona


1st Batxillerat INS ARGENTONA

PRESENTATION

Hi! We are David and Cristina, we are students of first of Batxillerat in the High School INS Argentona.

Argentona (Barcelona) is in Spain. This town doesn't have a beach, so we going to work with differents beaches of Mataró, that is a nearly city of Argentona. Mataró it's a city that is a central coast of Mataró.


We have choosen two Mataró beaches very separete it.. You have a photograph under the presentation.


We are in this project for do our work of Batxillerat and for this we will need your information for comparate differents beaches of the world with our Catalonia beaches.

I hope that together we can complete this project and that above all we can know how are the different beaches in the world.


                                              The beaches that we going to study. The two beaches are in Mataró.


Hello, this is our beach in Canet de mar.


Our geographical coordinates are: 41º 35' 3,87'' N 2º 34' 41,87'' E
For turbidity measurements we used a boat called Sunsmoke from Sant Andreu de Llavaneres: 41º 33' 43'' N 2º 30' 31'' E 
Good afternoon,

This is Bot Cove with all of us (1st ESO D), the place where we did the SST measures.

41º 0' 22,29'' N
0º 56' 27,14'' E

Miami Platja (Mont-roig del Camp).


The Sand (activity 3)

Good morning!

Congratulations to those that you have already sent the information. As soon as all participant schools have sent their data, we will put up a table where you will be able to compare the results.

In the meantime we are moving on to the next activity.


Activity nº 3: The Sand
Objective: complete the form The Sand >>

Source of data:
  • Survey (you have already done)
  • Experiments in the classroom
  • Internet
(Teachers will supply you with the information about the experiments and webpages)

Deadline to complete the form: 18th April
Please remember only one form per class!

We also want to remind that we would like you to post the photos of the beach you are studying along with the name of the beach, town and GPS coordinates. (Label: water)

All the best!

The S'Agulla Team